- Given the following box-and-whisker plot, decide if the data is skewed or symmetrical.
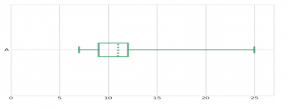
Select the correct answer below:
The data are skewed to the left.
The data are skewed to the right.
The data are symmetric.
THE CORRECT ANSWER IS B..(The data are skewed to the right)
2. Which of the data sets represented by the following histograms has the smallest standard deviation?
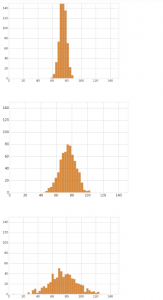
The correct answer is A.
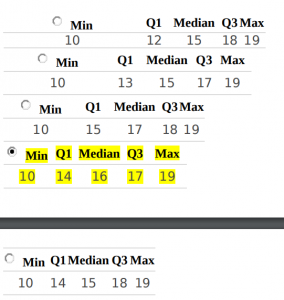
3. Given the following list of data, what is the five-number summary?
10, 12, 14, 14, 14, 16, 17, 17, 17, 19, 19
Select the correct answer below:
Min Q1 Median Q3 Max
10 12 15 18 19
Min Q1 Median Q3 Max
10 13 15 17 19
Min Q1 Median Q3Max
10 15 17 18 19
Min Q1 Median Q3 Max
10 14 16 17 19
The correct answer is: Min Q1 Median Q3 Max
10 14 16 17 19
please click the purchase button to access all WEEK 3 questions and answers